The final leg of a delivery is where logistics operations either earn their margin or lose it. In the US, last-mile delivery makes up roughly 53 percent of total shipping costs, according to industry data, and that figure has not meaningfully declined in years despite significant investment in technology and infrastructure. The reason is that the last-mile delivery challenges driving that number are structural, not incidental.
Consumer expectations have moved faster than most operations can adapt. Driver supply has tightened. Urban infrastructure was not designed for the delivery density that e-commerce now demands. Rural routes remain expensive because the economics of low stop density do not change regardless of the software layer on top.
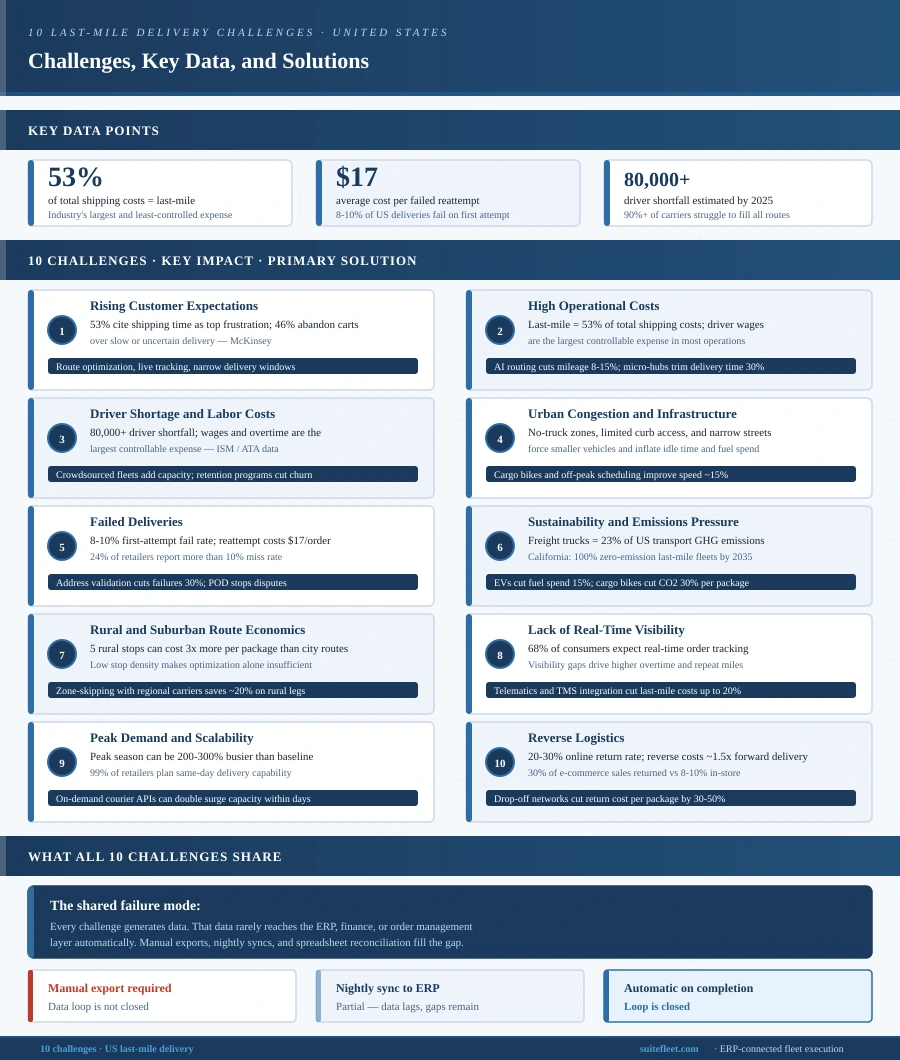
What follows is a map of the 10 most pressing last-mile delivery challenges for US operations, the data behind each one, and the solutions that have demonstrated measurable results. The goal is not a feature checklist but a practical account of what the problem actually is, what makes it hard, and what operational choices address it.
1. Rising Customer Expectations
The expectation baseline has shifted permanently. Ninety percent of US shoppers will accept a 2 to 3 day delivery window, but only if it is reliable and visible. According to McKinsey, 46 percent of consumers would abandon a cart over slow or uncertain delivery. Fifty-three percent cite shipping time as their top frustration.
The operational reality behind this last-mile delivery challenge is that customers have internalized the performance standards of the largest operators and now apply those standards to every retailer they buy from. A regional distribution company with 200 vehicles is measured against the same expectations as operators with 200,000.
The two interventions with the clearest impact are dynamic time-window scheduling and live tracking with automated notifications. Allowing customers to select delivery slots at checkout significantly improves first-attempt success rates because the recipient is actually home. Smart locker and time-slot combinations can cut failed deliveries by 10 to 15 percent. Live GPS tracking with automated SMS and email updates reduces inbound customer service calls by approximately 10 percent and misdeliveries by around 25 percent, because recipients who know exactly when their package is arriving make different decisions about their whereabouts.
The compounding effect: failed deliveries cost an average of $17 per reattempt. Every percentage point improvement in first-attempt success compounds directly into margin.
2. High Operational Costs
Last-mile delivery is expensive for structural reasons. Low stop density, labor intensity, fuel volatility, and vehicle wear combine to produce costs that resist straightforward reduction. Driver wages and overtime are the largest controllable expense in most last-mile operations. Suburban and rural routes make the problem worse by spreading those labor costs across fewer stops.
Advanced route optimization is the single highest-return intervention available to most operations facing this last-mile delivery challenge. UPS's ORION routing system cut mileage by 8 to 15 percent and fuel use by 8 to 20 percent across its network. The technology is no longer exclusive to operators at that scale. Cloud-based routing platforms that cluster stops, avoid peak-hour congestion, and minimize repositioning are now accessible to operations running 20 vehicles.
Micro-fulfillment hubs are the next lever for operations that have route optimization in place. Positioning inventory closer to demand centers reduces the first-mile and middle-mile distance before the last leg begins. Retailers that have implemented urban micro-fulfillment have reported delivery time reductions of around 30 percent. The tradeoff is capital and real estate cost, which makes this a mid-to-long-term investment rather than a quick fix.
Delivery consolidation, batching stops by zone or timeframe rather than fulfilling each order individually, can cut the number of vehicle trips by approximately 30 percent on high-density routes. The operational discipline required to hold orders for zone consolidation is the primary barrier, as it conflicts with same-day expectations unless customers are given a cost or service incentive to accept a later window.
The metric to watch: cost per delivery, not total shipping cost. Operations that optimize at the aggregate level often miss that specific route types, times of day, or vehicle classes are generating disproportionate expense.
3. Driver Shortage and Labor Costs
The US trucking and delivery industry was estimated to need more than 80,000 additional drivers by 2025, and last-mile roles face additional pressure because urban delivery work is physically demanding, parking conditions are stressful, and hourly wages have been rising faster than productivity gains. This last-mile delivery challenge compounds with every surge in e-commerce volume.
Crowdsourced and gig delivery platforms provide the most immediate capacity relief. Integrating on-demand courier APIs into dispatch allows operations to scale driver capacity for peak periods without adding fixed headcount. UPS's use of contract drivers during peak periods improved surge coverage by approximately 20 percent. The tradeoff is consistency and control, as gig drivers are less invested in on-time performance than employed drivers.
Automation in the last mile, drones and sidewalk robots, remains limited by regulatory approval requirements and geographic constraints. Drone delivery programs have demonstrated meaningful energy savings per package, with some estimates suggesting 70 to 94 percent less energy than conventional delivery on qualifying routes. But scale deployment in US markets is still limited to controlled zones and specific use cases.
The most underutilized lever is retention. DHL reported a 10 percent improvement in driver retention after implementing route optimization that reduced the daily stress of navigation and parking. Telematics that surface driver behavior data also create a basis for coaching rather than penalizing, which changes the relationship between operations management and drivers in a way that recruitment alone cannot.
The underlying problem: treating labor cost as a line item to minimize rather than a variable to optimize produces constant churn and chronic understaffing. The operations that have gotten ahead of the shortage have done so by making the work more manageable, not by cutting pay.
4. Urban Congestion and Infrastructure Constraints
Dense US cities present a specific set of last-mile delivery challenges that routing software alone cannot solve. Traffic congestion inflates travel time and fuel consumption. Narrow streets force smaller vehicles. Limited curb access creates double-parking situations that generate fines and delay subsequent stops. Morning no-truck zones in cities like New York and Los Angeles reduce the delivery window and push volume into congested midday periods.
Micro-dispatch using cargo bikes and small electric vans for inner-city routes addresses the infrastructure problem rather than trying to route around it. Cargo bikes navigate lanes and sidewalk areas that delivery vans cannot, and they do not require parking. Cities that have piloted cargo bike programs for urban cores have reported productivity gains of around 2x on dense routes and CO2 reductions of 30 percent per package.
Off-peak scheduling is a low-effort intervention with meaningful impact. Deliveries made before or after rush-hour periods move approximately 15 percent faster on comparable routes. The barrier is customer willingness to accept non-standard windows, which is addressable through pricing or incentive structures. Urban micro-hubs, aggregation points near transit stations or high-density residential areas, allow vehicles to drop consolidated loads that can then be distributed on foot or by bike for the final segment.
The city-specific variable: congestion pricing, no-truck zones, and curb access rules differ significantly between US cities. Operations running multi-city networks need city-level dispatch rules, not a single national routing policy.
5. Failed Deliveries
Approximately 8 to 10 percent of US deliveries fail on the first attempt — one of the most expensive last-mile delivery challenges in terms of direct and downstream cost. Each failed delivery generates a reattempt cost of around $17, and approximately 24 percent of e-retailers report that more than 10 percent of their orders miss on the first attempt. Beyond the direct cost, repeated failures drive customer churn in a way that is difficult to reverse.
Address validation at the point of order entry is the first line of defense. Deploying an address validation API during checkout catches malformed, incomplete, or non-deliverable addresses before an order is ever dispatched. Studies on address validation implementation have shown reductions in delivery failures of around 30 percent from this single change alone.
Electronic proof of delivery captures photo, signature, and GPS confirmation at the moment of completion. This eliminates disputes about whether a delivery occurred and creates an auditable record that protects both the driver and the retailer. Operations that implement mobile POD tools also gain data on where failures are happening, at what time, and with which drivers, which makes failure reduction a manageable operational problem rather than an unpredictable variable.
Proactive communication when ETAs slip, with an option to reschedule or redirect, converts potential failures into successful second-attempt deliveries before the first attempt is even made. The recipient who gets a notification that their package will arrive in 30 minutes makes a different decision about leaving the house than the recipient who had no idea a delivery was coming.
The return economics: failed deliveries do not just cost the reattempt fee. They generate customer service contacts, erode trust, and in some cases trigger chargebacks or refund requests. The true cost of a failed delivery is typically well above the $17 reattempt figure.
6. Sustainability and Emissions Pressure
US freight trucks accounted for 23 percent of transportation greenhouse gas emissions according to EPA data. California requires 100% zero-emission last-mile fleets by 2035. Other states are moving in the same direction. Consumer pressure is also real: 77 percent of US consumers consider eco-friendly delivery important, and 61 percent say they would pay more for it. This last-mile delivery challenge is both regulatory and commercial.
Fleet electrification is the long-term structural answer. UPS reported that its electric vehicle deployments cut fuel spend by approximately 15 percent and reduced CO2 meaningfully on the routes where EVs replaced diesel vans. The barrier is capital cost and charging infrastructure, both of which are improving but remain significant for smaller operators.
Cargo bikes and e-cargo scooters provide a near-term emissions reduction option for urban routes that do not require the full capital commitment of fleet electrification. DHL reported a 30 percent CO2 reduction in Zurich after introducing cargo bikes into its city delivery operations. For US urban operators, a dedicated cargo bike program for a defined inner-city zone is a testable, low-capital intervention that produces both emissions and operational benefits.
Route optimization is also an emissions strategy. Every mile cut from a route is a mile of fuel and emissions eliminated. Operations that frame route optimization purely as a cost reduction tool are leaving sustainability reporting value on the table, particularly as corporate emissions reporting requirements expand.
The regulatory timeline: California's 2035 deadline is not the only one coming. Operations that treat fleet electrification as a distant future problem are already behind on the planning and capital allocation required to meet the mandates that are already law.
7. Rural and Suburban Route Economics
Low stop density is the defining economic problem of rural and suburban last-mile delivery, and it is a last-mile delivery challenge that no amount of optimization fully resolves. A driver covering 5 rural stops across 40 miles is operating at a cost structure that is 3 or more times higher per package than a driver covering 30 urban stops in 8 miles. No amount of optimization changes that ratio meaningfully, because the constraint is geography, not process.
Zone-skipping and consolidation with regional carriers addresses the economics by not trying to own the entire last mile. Handing off rural and low-density suburban parcels to USPS or regional LTL carriers for the final segment leverages the existing infrastructure of operators who have already built the route economics into their pricing. Programs like USPS UPS SmartPost have demonstrated per-package savings of approximately 20 percent on rural legs.
Rural micro-hubs, small package lockers or pickup points at local stores and post offices, eliminate the problem of the final 10 to 15 miles entirely by shifting the last segment to the recipient. Customers pick up on their own schedule. The operator avoids an uneconomical route entirely. Similar to urban locker programs, rural hub networks reduce delivery count by approximately 20 percent on qualifying routes.
The planning insight: operations that apply a single national routing and pricing model to both urban and rural routes are subsidizing rural delivery with urban margin. Segmenting by route type and applying the appropriate fulfillment strategy to each segment is the first step toward making rural delivery financially viable.
8. Lack of Real-Time Visibility
Sixty-eight percent of US consumers expect real-time tracking on their deliveries. Most carriers do not have it, or have fragmented visibility that stitches together manual status updates rather than live GPS data. The operational consequence of this last-mile delivery challenge is that dispatchers cannot respond to exceptions as they develop, and customer service teams are answering status questions with outdated information.
Integrated telematics and TMS platforms that capture vehicle location, stop completion, and exception events in real time are the foundational investment. DHL's dynamic routing capability, built on real-time visibility data, cut last-mile costs by 20 percent by enabling dispatchers to respond to route disruptions before they cascaded into multiple failed deliveries. The combination of GPS hardware in vehicles and a dispatch console that surfaces live status eliminates the information gap that drives both operational inefficiency and customer frustration.
Automated customer alerts are the customer-facing layer of the same investment. FarEye data suggests that 91 percent of customers track their orders, and transparent real-time communication reduces inbound customer service calls by approximately 10 percent. A bot that answers 'where is my package?' without human involvement is not a luxury feature; it is a call center cost reduction.
The data gap: visibility investments that stop at the vehicle level miss the stop-level data that is most operationally useful. Knowing a van is in a neighborhood is less useful than knowing that stop 14 was completed and stop 15 is running 12 minutes late.
9. Peak Demand and Scalability
Holiday surges and promotional events can push delivery volumes 200 to 300 percent above baseline in US e-commerce operations. This last-mile delivery challenge separates operations that planned for scale from those that scramble in November. The operations that absorb peak well are the ones that have built flexible capacity into their model before the peak arrives.
Flexible fleet resources, on-demand courier partnerships and 3PL integration, provide surge capacity without the fixed cost of maintaining year-round headcount for peak volumes. Companies that have integrated crowdsourced delivery networks into their dispatch operations have reported the ability to double capacity within days during peak periods. The integration requires pre-negotiated rates and API connectivity with the surge network, not just a list of phone numbers.
A scalable tech stack is the other side of the equation. Dispatch and routing systems that run on fixed on-premise infrastructure create hard capacity ceilings at exactly the moment when capacity is most needed. Cloud-based routing platforms handle 3x normal loads without performance degradation. The technology choice made during normal operating periods determines whether the peak is manageable or a crisis.
The demand management angle: peak pricing that incentivizes customers to shift orders to off-peak slots is both a margin tool and a capacity tool. E-commerce operators that have implemented dynamic delivery pricing have shifted 15 percent of peak demand to off-peak windows. That 15 percent is often the difference between a manageable peak and a missed-SLA crisis.
10. Reverse Logistics
US online return rates reach 20 to 30 percent for many product categories. Processing returned packages is effectively a second last-mile operation running in reverse, and it costs approximately 1.5 times the forward delivery cost per item. Invesp data indicates that roughly 30 percent of e-commerce sales are returned, compared to 8 to 10 percent in physical stores. Reverse logistics is the most underinvested of all last-mile delivery challenges.
Easy return drop-off points, parcel shops, lockers, and in-store bins, reduce the cost of returns by eliminating the need for courier pickup entirely. Happy Returns reported a 30 to 50 percent reduction in return cost per package for operations that shifted from home pickup to drop-off networks. Customers get a faster, simpler return experience. Operators get consolidated return volumes that can be processed in batch rather than one package at a time.
Pre-printed return labels and automated reverse pickup scheduling reduce friction for customers and give operators planning visibility on incoming return volume. FedEx reported a 20 percent faster return cycle time for operations that automated return scheduling rather than handling it through customer service. Faster cycle times mean inventory is back in sellable condition sooner, which matters for margin on high-return-rate categories like apparel.
Return analytics are underused. Most operations know their aggregate return rate but not why specific products are returned at above-average rates, which customers generate disproportionate return volumes, or which routes have the highest rate of damaged-on-arrival returns. Operations that have deployed return analytics and used the data to adjust product listings, packaging, or carrier selection have reduced return rates by up to 25 percent on targeted categories.
The inventory connection: reverse logistics is not just a shipping cost problem. Returns that take 14 days to process are inventory that cannot be sold for 14 days. The cost of slow reverse logistics lives on the balance sheet as much as it lives in the P&L.
Frequently Asked Questions
What are the biggest last-mile delivery challenges in the US?
The 10 biggest last-mile delivery challenges in the US are: rising customer expectations (46% of shoppers abandon carts over slow delivery), high operational costs (last-mile accounts for 53% of total shipping cost), driver shortage (80,000+ additional drivers needed), urban congestion and infrastructure constraints, failed deliveries (8–10% first-attempt failure rate), sustainability and emissions pressure, rural and suburban route economics, lack of real-time visibility, peak demand scalability, and reverse logistics (returns cost 1.5x the forward delivery cost).
Why is last-mile delivery so expensive in the US?
Last-mile delivery is expensive because it is labor-intensive, low in stop density outside urban cores, and sensitive to fuel and wage volatility. Driver wages and overtime are the largest controllable expense. Suburban and rural routes spread those labor costs across fewer stops, making cost-per-package economics structurally worse than urban delivery. Combined with rising customer expectations for speed and visibility, the cost pressure has increased even as technology investment has grown.
How can companies reduce last-mile delivery costs?
The four interventions with the clearest demonstrated impact are: (1) route optimization, which cut mileage by 8–15% in UPS's ORION deployment; (2) delivery consolidation by zone, which can reduce vehicle trips by up to 30%; (3) micro-fulfillment hubs positioned near demand centers, which reduced delivery times by ~30% for retailers that implemented them; and (4) improving first-attempt success rates through time-window scheduling and proactive customer communication, since each failed delivery costs ~$17 to reattempt.
What is the average cost of a failed delivery?
The average cost of a failed first-attempt delivery in the US is approximately $17 per reattempt. This figure covers only the direct redelivery cost. The true cost is significantly higher when accounting for customer service contacts, customer churn, and in some cases chargebacks or refund requests triggered by failed attempts. Approximately 24% of US e-retailers report that more than 10% of their orders fail on the first attempt.
How does route optimization help with last-mile delivery challenges?
Route optimization addresses last-mile delivery challenges by reducing mileage, cutting fuel consumption, and improving the density of stops per route. UPS's ORION system cut mileage by 8–15% and fuel use by 8–20% at scale. Modern cloud-based route optimization platforms make these gains accessible to operations running as few as 20 vehicles. Dynamic optimization that recalculates routes in real time as conditions change provides additional value beyond static pre-day planning.
What percentage of deliveries fail on the first attempt in the US?
Approximately 8 to 10 percent of US deliveries fail on the first attempt. Roughly 24 percent of e-retailers report that more than 10 percent of their orders fail first-attempt delivery. The primary causes are recipients not being home, incomplete or incorrect addresses, access issues, and deliveries refused due to damage. Address validation at checkout, proactive ETA notifications, and time-window scheduling at checkout are the three interventions with the clearest impact on first-attempt success rates.
The Layer These Challenges Share
The 10 last-mile delivery challenges above are operationally distinct but connected by a common failure mode. Each one generates data, and that data rarely reaches the systems that need it automatically. A failed delivery generates a record in the dispatch system. That record rarely triggers an update in the ERP, adjusts the invoice, or flags a customer account. A returned package generates a reverse shipment. That event rarely closes the original order or updates inventory without a manual step.
Operations that have made the most progress on last-mile delivery challenges are the ones that closed these data loops, not just the ones that bought better routing software. The routing software matters. So does the driver app, the POD capture, and the customer notification layer. What determines whether those investments compound or stay isolated is whether the execution data flows automatically to the financial, inventory, and order management systems the rest of the business runs on.
SuiteFleet connects last-mile delivery execution to the ERP layer so that what happens on the road updates the systems that run the business automatically. Dispatch, routing, proof of delivery, and real-time tracking built for ERP-connected operations.